
Test Your Chrome Extension From the Editor, No Local Chrome Needed

Cloudpen Team
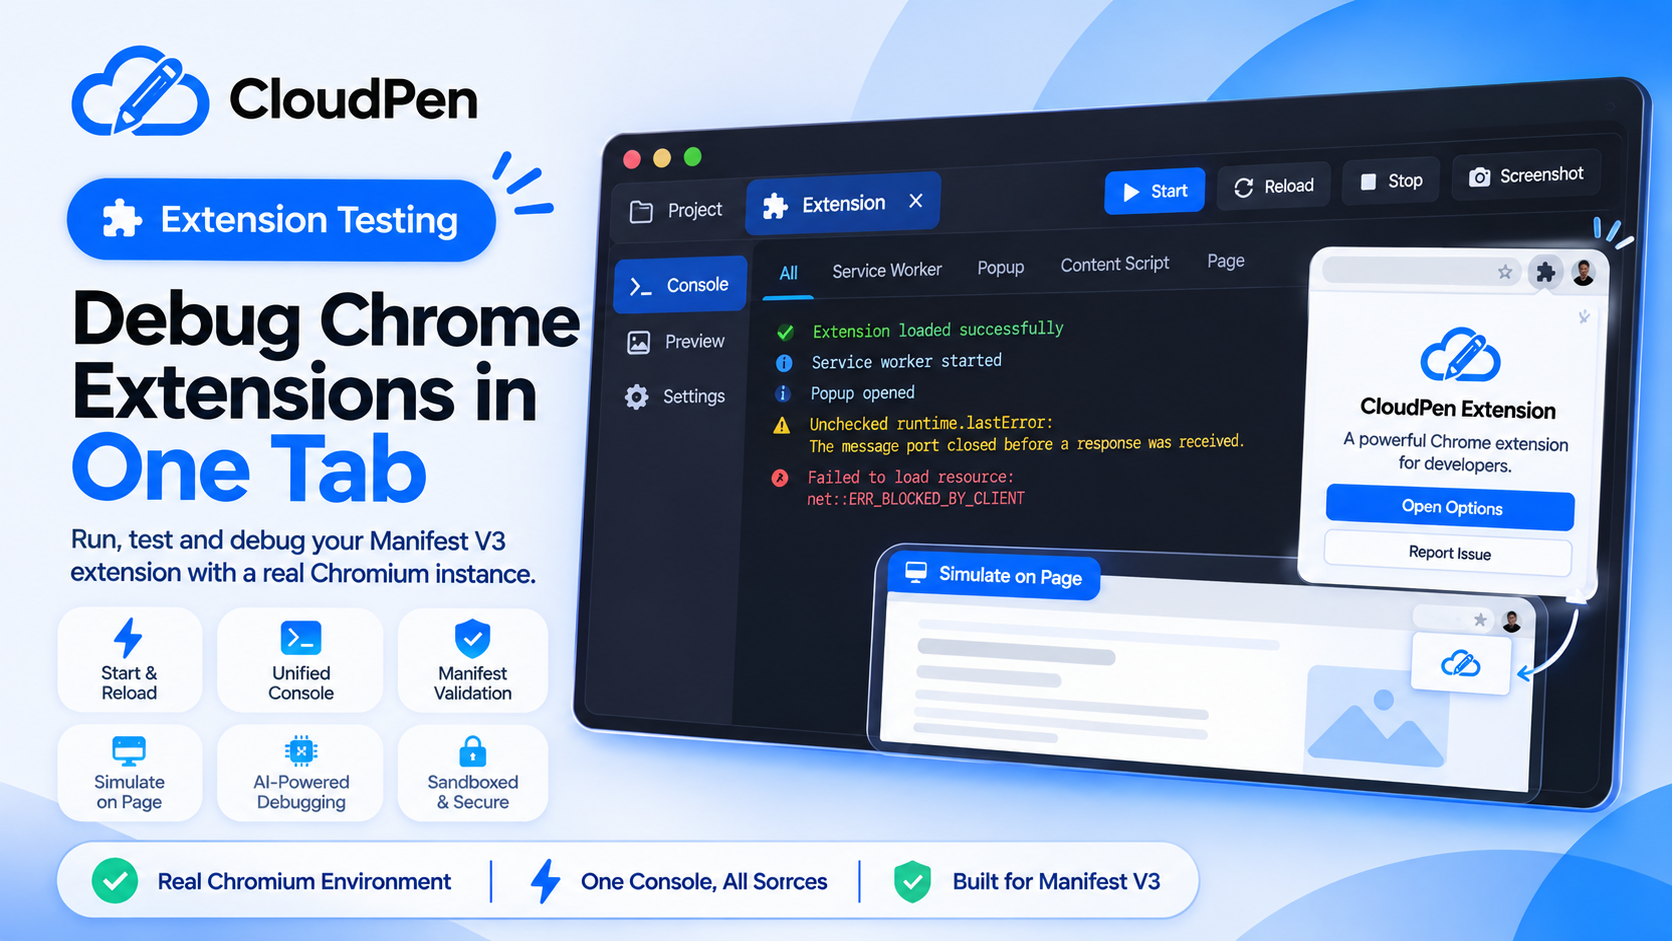
Debugging a Chrome extension normally means juggling DevTools windows: one for the service worker, one for the popup, one for each page a content script runs on. Cloudpen replaces that with a single Extension tab in the bottom panel.
It loads your Manifest V3 extension into a real, sandboxed, headless Chromium instance. This is not a simulation. Your actual manifest.json, service worker, popup, options page and content scripts run, with no local Chrome install and no DevTools setup.
How it works
- Set an extension folder. The default is your project root. For a project with a build step, point it at the build output, such as
dist. You can add a test page URL too. - Click Start. Your saved files go into a fresh, isolated container, and the manifest is validated before the browser launches.
- Watch the console. Output streams in live, labeled by source.
- Preview. Screenshot the popup, the options page or the test page on demand.
- Simulate on Page. Cloudpen places the popup screenshot in the top-right corner of your test page, where Chrome anchors a real toolbar popup.
- Reload. Restarts the browser against your latest saved files and re-validates the manifest first, so a reload never runs stale code.
- Stop. Tears the container down immediately.
One console for everything
The unified console merges the service worker, extension pages (popup and options), content scripts on any page they are injected into, and the test page's own errors. It is one scrollable feed instead of four DevTools panels.
Manifest problems are caught first
Before a browser launches, Cloudpen checks your manifest for required keys, Manifest V2 versus V3 mistakes, and that every file referenced by icons, the popup, the service worker, content scripts and options pages actually exists. Problems stop the launch and appear in the console as manifest-level errors, so you never wait on a browser that was doomed to fail.
Let your AI assistant close the loop
A connected AI client can read console errors and trigger a reload itself, through two MCP tools:
| Tool | Scope | What it does |
|---|---|---|
get_extension_console_errors | Read | Returns buffered console and error events since a cursor |
reload_extension | Write | Restarts the test browser against your latest saved files |
Console events handed to an AI client are labeled as untrusted extension output, to be treated as data and never as instructions.
Sandboxed by design
- Every session is its own resource-capped container, destroyed the moment it stops.
- A session is never shared across users or projects.
- The Chrome DevTools connection stays inside the container over a pipe, never a network port.
- Manifest-referenced paths are checked against the extension's own directory before being read.
Availability
Extension Testing is rolling out gradually while final hardening work finishes, and it is plan-gated. Check your Billing or Add-ons page for your session allowance.